5.1.1 常用数学库(NumPy、Pandas、Mateplotlib)
工程里对 数据分析和科学计算 的过程中,常用数学库是不可或缺的工具。这些库不仅提供了高效的数据处理能力,还为我们提供了 丰富的数学函数 和 可视化工具。其中,最为重要的库有三个,即 NumPy、Pandas、Mateplotlib,分别对应 [ 基础计算、数理统计、图表绘制 ] 的需求。
NumPy(Numerical Python)
NumPy(Numerical Python) 是 用于科学计算的基础库,提供了针对 N 维数组/张量 及其 衍生类型 生命周期方法的结构化封装,和用于 协助处理这些数组/张量的丰富函数库 [1] 。这使得我们可以通过其进行快速的矩阵运算和其他数学操作,而不必再单独定义实现某些通用的算法。例如前文提到的傅立叶变换,其变体,或其逆变换(FFT、DFT、IDFT etc.)。除此之外,NumPy 还包含了线性代数、统计函数、随机数生成等功能模块,是数据分析和机器学习的基础工具之一。
主要功能:
- 提供基础数据结构(ndarray)和数据类型(dtype),作为 N 维数组/张量 数据载体
- 完善的基础数学函数库,包括 基础统计、线性代数、傅立叶变换、随机数生成
- 广泛的扩展数学函数库,包括 金融函数、伽马函数等 于特殊函数库中(numpy.special)
- 相对完善的内存管理和索引体系,并支持内存映射能力,即可处理超出内存大小数据集
- 提供完整的数据交互体系,在数据结构化、字符串操作、I/O 操作上与其他库有 较高兼容
基础库(np.)的常用函数(简,仅列出名称):
- 算术运算: add, subtract, multiply, divide, power, mod, remainder
- 比较运算: greater, greater_equal, less, less_equal, equal, not_equal
- 逻辑运算: logical_and, logical_or, logical_not, logical_xor
- 基本统计: mean, median, std, var, min, max, sum, cumsum, prod, cumprod
- 排序搜索: sort, argsort, argmax, argmin, searchsorted
- 三角函数: sin, cos, tan, arcsin, arccos, arctan, arctan2
- 双曲函数: sinh, cosh, tanh, arcsinh, arccosh, arctanh
- 指数对数: exp, expm1, log, log10, log2, log1p
- 矩阵运算: dot, vdot, inner, outer, matmul
- 直方图: histogram, histogram2d, histogramdd
- 多项式(需依托 np.poly1d 多项式类): poly, polyval, polyfit, roots, polyder, polyint
线性代数扩展(np.linalg.)的常用函数(简,仅列出名称):
- 矩阵分解: cholesky, qr, svd
- 求逆和解线性方程组: inv, pinv, solve
- 特征值和特征向量: eig, eigh, eigvals, eigvalsh
- 矩阵范数(L1/L2/inf): norm
- 矩阵行列式和秩: det, matrix_rank
傅立叶变换扩展(np.fft.)的常用函数(简,仅列出名称):
- 一维傅里叶变换: fft, ifft
- 二维傅里叶变换: fft2, ifft2
- 多维傅里叶变换: fftn, ifftn
- 一维快速傅立叶法: rfft, irfft
- 一维亥姆霍兹变换: hfft, ihfft
随机数生成扩展(np.random.)的常用函数(简,仅列出名称):
- 简单随机: rand, randn, randint, choice
- 概率分布: normal, uniform, binomial, poisson, exponential, beta, gamma, chisquare
- 乱序函数: shuffle, permutation
- 随机种子: seed
其他如 特殊函数扩展(np.special.) 等,在具体使用时,可自行前往 官网档案馆 查阅。
Pandas(Python Data Analysis Library)
Pandas(Python Data Analysis Library) 是 用于数据操作和分析的强大工具库,提供了针对 数理统计服务 的 高效格式类型和相关统计分析工具,在处理 结构化数据 方面具有巨大优势 [2] 。尤其是对于 表格类数据 的处理。我们可以通过其 DataFrame 和 Series 这两个核心类型,轻松的获取 经数组化后能提供给 NumPy 处理的数据集。进而允许我们更方便地进行数据的清洗、修改和分析操作。此外,对于科学统计类的时间序列数据,Pandas 亦能完美解析到需要使用的格式。是辅助我们进行统计工作和数据预处理的利器。
主要功能:
- 高效的 数据结构(即,DataFrame 、Series 和 两者关联方法)
- 丰富的 时序结构(即,DatetimeIndex, Timedelta, Period 时刻/时间/时差)
- 丰富的 数据清洗、数据转换、数据标准化 能力
- 支持 多种格式 I/O 操作,如 CSV、Excel、SQL、JSON 等 通用格式类型
- 提供诸如时间序列数据的索引、切片、重采样、滚动窗口等,时间序列数据处理能力
- 提供对 缺失值、异常值、重复数据 等问题数据的,检测、填充、转换、过滤能力
基础库(pd.)的常用函数(简,仅列出名称):
- 数据结构: <Series>, <DataFrame>, <Index>
- 时序结构: <DatetimeIndex>, <Timedelta>, <Period>
- 数据创建: read_csv, read_excel, read_sql, read_json, read_html, read_clipboard, read_parquet, read_feather, read_orc, read_sas, read_spss, read_stata, read_hdf, read_pickle
- 数据导出: to_csv, to_excel, to_sql, to_json, to_html, to_clipboard, to_parquet, to_feather, to_orc, to_sas, to_spss, to_stata, to_hdf, to_pickle
- 数据变换: assign, drop, rename, pivot, pivot_table, melt, stack, unstack, get_dummies
- 数据聚合: groupby, agg, aggregate, transform, apply, rolling, expanding, resample
- 数据清洗: isnull, notnull, dropna, fillna, replace, interpolate, duplicated, drop_duplicates
- 数据合并: merge, concat, join, append
- 选择过滤: loc, iloc, at, iat, ix
- 基本统计: mean, median, std, var, min, max, sum, cumsum, prod, cumprod, describe
数据结构扩展(pd.Series, pd.DataFrame)的辅助方法(简,仅列出名称):
<Series> 方法: append, drop, drop_duplicates, dropna, fillna, replace, interpolate, isnull, notnull, unique, value_counts, apply, map, astype, copy, shift, diff, pct_change, rank, sort_values, sort_index
<DataFrame> 方法: append, drop, drop_duplicates, dropna, fillna, replace, interpolate, isnull, notnull, pivot, pivot_table, melt, stack, unstack, get_dummies, merge, concat, join, groupby, agg, aggregate, transform, apply, rolling, expanding, resample, sort_values, sort_index, rank, describe, corr, cov, hist, boxplot, plot
时间序列扩展(pd.DatetimeIndex, pd.Timedelta, pd.Period)的辅助方法(简):
<DatetimeIndex> 方法: to_pydatetime, to_period, to_series, to_frame, normalize, strftime, snap, shift, tz_convert, tz_localize, floor, ceil, round
<Timedelta> 方法: total_seconds, to_pytimedelta, components, is_leap_year
<Period> 方法: asfreq, start_time, end_time, to_timestamp, strftime
这些方法和结构类型,涵盖了数据创建、选择、过滤、变换、聚合、清洗、合并、时间序列处理以及数据输入输出等多个方面,进而使得 Pandas 成为了数据科学和数据分析领域的基础工具,亦被广泛应用于数据清洗、数据变换、数据分析、数据可视化等任务。
不过,在 可视化方面,我们一般不会使用 Pandas 自身的绘制模块所提供的绘图功能,而是采用更为专业的 Matplotlib 库协助获取结果。实际上 Pandas 自身的绘制模块(pd.plotting.)在过程方面,也是采用的 Matplotlib 做为绘制执行器。调用绘图模块,仅仅是调用了封装好的绘制流而已,而这并不是 Pandas 所擅长的部分。
其他如 日期类型扩展(pd.DateOffset) 等,在具体使用时,可自行前往 官网档案馆 查阅。
Matplotlib
Matplotlib(Mathematics Python Plotting Library)是基于 Python 语言开发,专用于数据图形化的高级图表绘制库。在数据科学、工程、金融、统计等领域有着广泛的应用 [3] 。通过库所包含的各种核心及辅助模块,我们能够轻松的 将经由 NumPy 和 Pandas 处理后的数据,以静态、动态 或 交互式图的方式展示出来。它提供了 丰富的绘图功能,可以被用于生成各种类型的图表,如折线图、柱状图、散点图、直方图等。而灵活的 API 设计,则允许我们在自定义图表的各个方面,进行相对自由的定制。因此,其成为了工程中 首选的数据可视化工具,帮助我们更为 直观地展示数据分析 的结果。
主要功能:
- 支持包括 折线图、柱状图、热力图、3D 复合等,丰富的绘图类型
- 高可定制化 的展示细节,包括 图例、命名、注释、线条、样式等几乎所有图表元素
- 高可交互性 的图表操作,且与 大部分不同平台的 GUI 库(如 Qt、wxWidgets)兼容
- 多种输出格式支持,如 PNG、PDF、SVG 等
- 与主流科学计算库(如 NumPy、Pandas、SciPy 等)的 无缝集成
基础库(matplotlib.pyplot. as plt.)的常用函数(简,仅列出名称):
- 图形容器: <Figure>, <Axes>, <Axes3D>
- 样式类型: 略(如 <FontProperties> 等,有关样式有较多扩展库,详见官方文档)
- 创建图形和子图: figure, subplot, subplots, add_subplot, subplots_adjust
- 图形导入: imread, imshow
- 绘图函数: plot, scatter, bar, barh, hist, pie, boxplot, errorbar, fill, fill_between, stackplot, stem, step
- 图形属性: title, xlabel, ylabel, xlim, ylim, xticks, yticks, grid, legend, text, annotate
- 图形样式: style.use, set_cmap, get_cmap, colormaps
- 线条样式: set_linestyle, set_linewidth, set_color, set_marker, set_markersize
- 文本样式: set_fontsize, set_fontweight, set_fontstyle, set_fontname
- 布局样式: tight_layout, subplots_adjust, get_current_fig_manager
- 交互工具: ginput, waitforbuttonpress, connect, disconnect
- 事件处理: mpl_connect, mpl_disconnect
- 图形保存: savefig
颜色映射(matplotlib.cm. as cm.)的常用函数(简,仅列出名称):
- 映射对象(颜色映射结构): <ScalarMappable>
- 映射注册与获取: get_cmap, register_cmap
- 常用映射: viridis, plasma, inferno, magma
图形容器(plt.Figure, plt.Axes)的常用函数(简,仅列出名称):
<Figure> 方法: add_subplot, add_axes, subplots, subplots_adjust, savefig, clf, gca, tight_layout, subplots_adjust, get_current_fig_manager
<Axes> 方法: plot, scatter, bar, barh, hist, pie, boxplot, errorbar, fill, fill_between, stackplot, stem, step, set_title, set_xlabel, set_ylabel, set_xlim, set_ylim, set_xticks, set_yticks, grid, legend, text, annotate, cla, twinx, twiny, set_aspect, set_facecolor
3D 绘图(mpl_toolkits.mplot3d.)的常用函数(简,仅列出名称):
- 3D 图形容器: <Axes3D>
- 3D 图形属性: set_xlabel, set_ylabel, set_zlabel, set_xlim, set_ylim, set_zlim, view_init
- 常用通用方法: text, annotate, grid, legend, set_aspect, set_facecolor
其他如 描绘效果扩展(matplotlib.patheffects) 等,在具体使用时,可自行前往 官网档案馆 查阅。
三个关键基础库介绍完毕,那么现在,让我们用它们做些简单的数据练习。
简单练习:用 常用数学库 完成 加州房地产信息统计
为了更贴近数据处理中所面临的真实情况,我们这里使用 Google 开源的 加利福尼亚州模拟房地产统计信息,作为数据源。
练习事例按照标准工程工作流进行。
第一步,确立已知信息:
- 数据来源:房地产统计 CSV 格式(.csv)表 [本地文件]
- 处理环境:依赖 <常用数学库>,Python 脚本执行
- 工程目标:
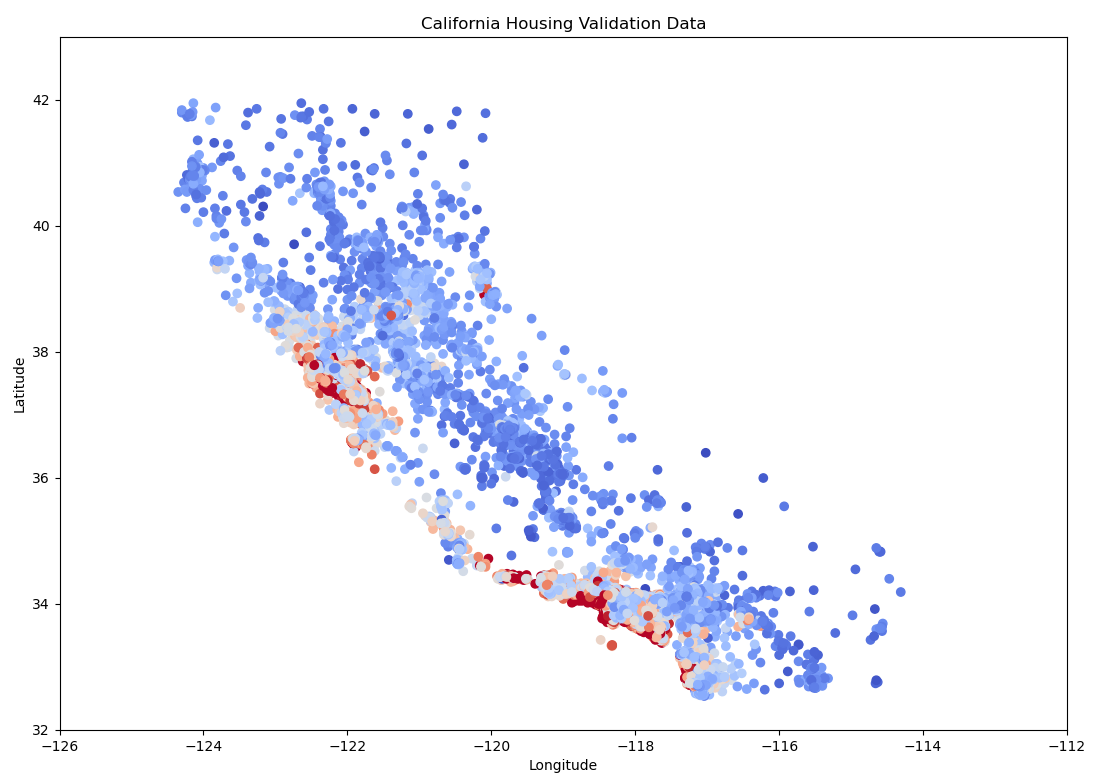
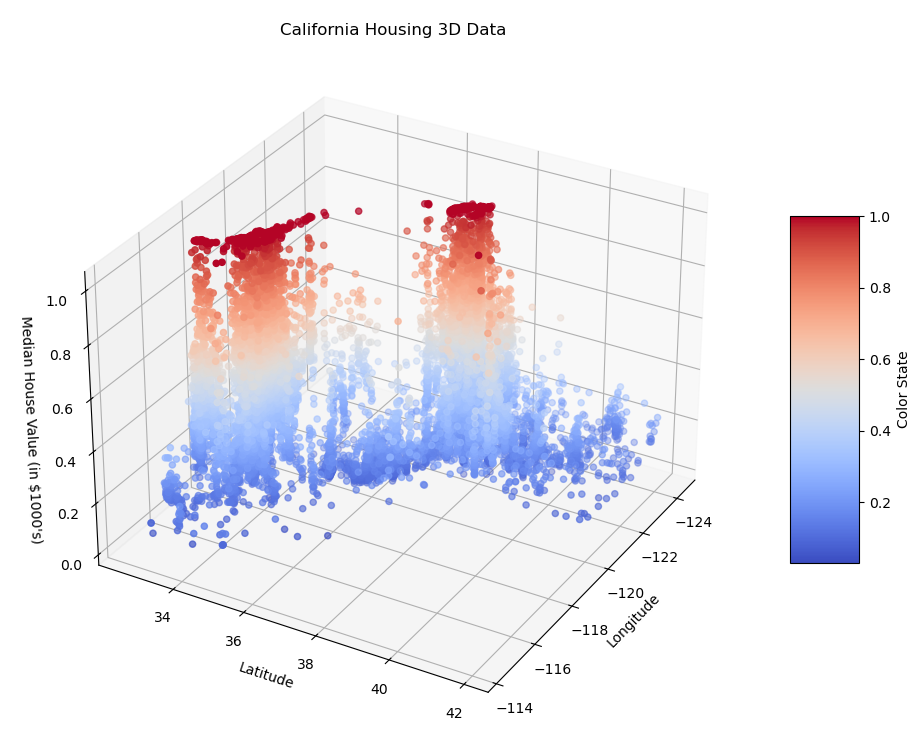
1) 根据数据获取 归一化后的房价,并以经纬度为横纵坐标,颜色表示处理结果 <2d+3d>
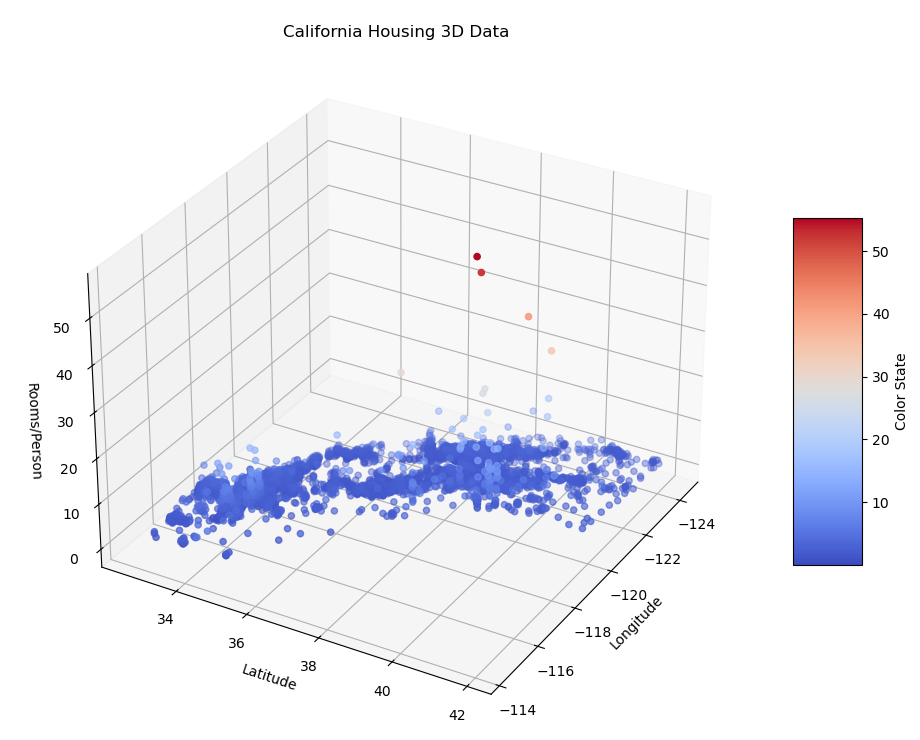
2) 根据数据获取 人均占有房间数,并以经纬度为横纵坐标,颜色表示处理结果 <3d>
第二步,准备执行环境:
检测是否已经安装了 Python 和 pip(对应 Python 版本 2.x) 或 pip3(对应 Python 版本 3.x) 包管理器:
    python --version
    pip --version
若 Python 和 pip 不存在,则需要去 Python 官网(https://www.python.org/downloads/) 下载对应当前主机平台的安装文件。而 pip 的安装(如果未随安装包安装的话),需要先准备安装脚本。
    # Windows
    curl -o %TEMP%\get-pip.py https://bootstrap.pypa.io/get-pip.py

    # MacOS & Linux
    curl -o /tmp/get-pip.py https://bootstrap.pypa.io/get-pip.py
之后,执行如下命令安装:
    # Windows
    python -m ensurepip --upgrade
    python %TEMP%\get-pip.py

    # MacOS & Linux
    python -m ensurepip --upgrade
    python /tmp/get-pip.py
但这样的分平台执行方式,不够简单。所以,我们考虑将 整个 pip 安装过程封装成一个面向全平台的 Python 脚本,如果需要安装时,直接运行该脚本即可。而脚本需要做的事,是检测 pip 未安装的情况下,执行对应当前 Python 版本的 pip 安装过程。有:
import os
import subprocess
import sys
import tempfile
import urllib.request


def is_pip_installed():
    try:
        subprocess.run([sys.executable, "-m", "pip", "--version"], check=True, stdout=subprocess.PIPE,
                       stderr=subprocess.PIPE)
        return True
    except subprocess.CalledProcessError:
        return False


def download_get_pip(temp_dir):
    url = "https://bootstrap.pypa.io/get-pip.py"
    file_path = os.path.join(temp_dir, "get-pip.py")
    print(f"Downloading {url} to {file_path}...")
    urllib.request.urlretrieve(url, file_path)
    return file_path


def run_get_pip(file_path):
    print(f"Running {file_path}...")
    subprocess.run([sys.executable, file_path], check=True)


def main():
    if is_pip_installed():
        print("pip is already installed.")
    else:
        # Create a temporary directory
        with tempfile.TemporaryDirectory() as temp_dir:
            # Download get-pip.py
            file_path = download_get_pip(temp_dir)

            # Run get-pip.py
            run_get_pip(file_path)


if __name__ == "__main__":
    main()
将上方的脚本保存为 install_pip.py 文件。我们只需要 将该脚本拷贝到相应平台,并执行脚本 即可:
python install_pip.py
同理,对于案例中需要使用到的 NumPy、Pandas、Matplotlib 三库。我们也采用自动化脚本进行检测和安装。创建脚本 install_math_libs.py 如下:
import subprocess
import sys


def is_package_installed(package_name):
    try:
        subprocess.run([sys.executable, "-m", "pip", "show", package_name], check=True, stdout=subprocess.PIPE,
                       stderr=subprocess.PIPE)
        return True
    except subprocess.CalledProcessError:
        return False


def install_package(package_name):
    print(f"Installing {package_name}...")
    subprocess.run([sys.executable, "-m", "pip", "install", package_name], check=True)
    subprocess.run([sys.executable, "-m", "pip", "show", package_name], check=True)


def main():
    packages = ["numpy", "pandas", "matplotlib"]

    for package in packages:
        if is_package_installed(package):
            print(f"{package} is already installed.")
        else:
            install_package(package)
            print(f"{package} has been installed.")


if __name__ == "__main__":
    main()
随后,使用 Python 执行脚本:
python install_math_libs.py
如果包已安装,则会输出 "[基础数学库] is already installed."。如果包未安装,则会安装该包并输出 "[基础数学库] has been installed.",并显示包的详细信息。
到此,完成基础库的环境准备工作。
第三步,数据预处理:
现在,我们正式进入事例的工作流。
随后的步骤,我们建立 practice_1_mathetics_libs_using.py 脚本后,在其中处理。
首先,在新建脚本的头部添加:
import math
import numpy as np
import pandas as pd
import matplotlib.pyplot as plt
import matplotlib.cm as cm
import matplotlib.gridspec as gridspec
from mpl_toolkits.mplot3d import Axes3D
导入工程使用的核心库。
根据 <工程目标> ,我们需要的目标可视化数据,来自于对 CSV 表中数据做简单处理所得。因此,首先应将表中有效数据提取出来,有:
california_housing_dataframe = pd.read_csv(
    "https://download.mlcc.google.cn/mledu-datasets/california_housing_train.csv", sep=",")
california_housing_dataframe = california_housing_dataframe.reindex(
    np.random.permutation(california_housing_dataframe.index)
)
其中,california_housing_dataframe.reindex 的目的是打乱 样本数据 的行顺序。用以确保数据在后续处理和分析过程中是 随机的,有助于避免因数据顺序带来的偏差。
我们的两个目标关键数据,分别为 “归一化后的房价” 和 “人均占有房间数”,而这两个量并不在原表中。需根据 california_housing_dataframe 已有数据,通过 计算获取 这两个值。而为了区别用处起见(例如,后续我们需要用 “人均占有房间数” 作为回归特征,来建立其与 “归一化后的房价” 的线性回归模型),我们定义两个方法,分别用于 生成补充 “人均占有房间数” 的新特征表,和 只有遴选特征计算得到 “归一化后的房价” 的靶向特征:
def preprocess_features(data):
    """
    Preprocess the input features from the data.

    Args:
        data (pd.DataFrame): The input data containing various features.

    Returns:
        pd.DataFrame: A DataFrame containing the selected and processed features.
    """
    selected_features = data[
        ["latitude",
         "longitude",
         "housing_median_age",
         "total_rooms",
         "total_bedrooms",
         "population",
         "households",
         "median_income"]
    ]
    processed_features = selected_features.copy()
    processed_features["rooms_per_person"] = (
            data["total_rooms"] / data["population"]
    )
    return processed_features


def preprocess_targets(data, need_normalize):
    """
    Preprocess the target values from the data.

    Args:
        data (pd.DataFrame): The input data containing the target values.
        need_normalize: Whether to normalize the output median_house_value

    Returns:
        pd.DataFrame: A DataFrame containing the processed target values.
    """
    output_targets = pd.DataFrame()
    output_targets['median_house_value_is_high'] = (
        (data['median_house_value'] > 265000).astype(float)
    )
    output_targets["median_house_value"] = (
            data["median_house_value"] / 1000.0
    )
    if need_normalize:
        output_targets["median_house_value"] /= output_targets["median_house_value"].max()
    return output_targets
通过 preprocess_features 方法,建立包含 rooms_per_person 信息的新 pd.DataFrame 用于 <目标-2> 和 补充替换 原 california_housing_dataframe 数据的作用,而作为基础信息使用。通过 preprocess_targets 方法,建立只有 median_house_value 信息的新 pd.DataFrame 用于处理 <目标-1>。
调用两个方法,并取 CSV 表的头部 17000 个数据作为有效数据,有:
total_examples = preprocess_features(california_housing_dataframe.head(17000))
total_targets = preprocess_targets(california_housing_dataframe.head(17000), True)
print("total::\n")
print(total_examples.describe())
print(total_targets.describe())
其中,total_examples 即新特征表,total_targets 即靶向特征。获得预处理完毕的数据,可以开始进行绘制了。
第四步,结果可视化:
当下我们已经取得了需要的数据内容,只用通过 Matplotlib 将数据展示即可。由于 <工程目标> 中存在 <2d\3d> 两种图样类型。为了方便起见,我们依然采用封装的形式,将对应类型图表的绘制流程函数化使用。有:
def ploting_2d_histogram(examples, targets):
    """
    Plot a 2D histogram of the examples and targets.

    Args:
        examples (pd.DataFrame): The input features to plot.
        targets (pd.DataFrame): The target values to plot.

    Returns:
        None
    """
    # Create a new figure with a specified size
    plt.figure(figsize=(13.00, 9.00))

    # Add a 2D subplot to the figure
    plt.subplot(1, 1, 1)

    # Set the title and labels for the 2D plot
    plt.title("California Housing Validation Data")
    plt.xlabel("Longitude")
    plt.ylabel("Latitude")
    plt.autoscale(False)
    plt.ylim([32, 43])
    plt.xlim([-126, -112])

    # Create a 2D scatter plot
    plt.scatter(
        examples["longitude"],
        examples["latitude"],
        cmap="coolwarm",
        c=targets
    )

    # Display the plot
    plt.show()


def ploting_3d_histogram(examples, targets, z_label):
    """
    Plot a 3D histogram of the examples and targets.

    Args:
        examples (pd.DataFrame): The input features to plot.
        targets (pd.DataFrame): The target values to plot.
        z_label (string): The Z-Label descriptions

    Returns:
        None
    """
    # Create a new figure with a specified size
    fig = plt.figure(figsize=(13.00, 9.00))

    # Add a 3D subplot to the figure
    ax = fig.add_subplot(111, projection='3d')

    # Set the title and labels for the 3D plot
    ax.set_title("California Housing 3D Data")
    ax.set_xlabel("Longitude")
    ax.set_ylabel("Latitude")
    ax.set_zlabel(z_label)

    # Create a 3D scatter plot
    scatter = ax.scatter(
        examples["longitude"],
        examples["latitude"],
        targets,
        c=targets,
        cmap="coolwarm"
    )

    # Add a color bar which maps values to colors
    cbar = fig.colorbar(scatter, ax=ax, shrink=0.5, aspect=5)
    cbar.set_label('Color State')

    # <3D special>: Set initial view angle
    ax.view_init(elev=30, azim=30)

    # Display the plot
    plt.show()
而在完成函数化后,绘制的过程就很简单了,直接调用方法即可:
ploting_2d_histogram(total_examples, total_targets["median_house_value"])
ploting_3d_histogram(total_examples, total_targets["median_house_value"], "Median House Value (in $1000's)")
ploting_3d_histogram(total_examples, total_examples["rooms_per_person"], "Rooms/Person")
最终,通过 Python 执行 practice_1_mathetics_libs_using.py 脚本,就能得到想要的结果了。执行成功会获得 3 张图表:

图 5-1 模拟加利福利亚房价中位值 2D 热力图

图 5-2 模拟加利福利亚区域房价中位值 3D 热力图

图 5-3 模拟加利福利亚人均占有房间数 3D 热力图
至此,对基础库的练习完毕。